Showing posts with label Apple Quarterly Revenue. Show all posts

Saturday, January 31, 2015

The Earnings Trend Is Again Apple’s Friend

On Tuesday, January 27th, Apple announced December quarter results with record revenue of $74.599 billion, record net income of $18.024 billion and record earnings per share of $3.06. Beyond those superlatives, Apple also set a global record for quarterly net income of any publicly-traded enterprise in history. The depth, spread and scope of Apple’s December quarter success caught even the most bullish Wall Street analysts by surprise. 

The good news for Apple shareholders is the company’s December quarter results are not a crescendo but merely the first fiscal episode in a new epoch of outsized enterprise success.

The Earnings Trend Is Again Apple’s Friend
The graphs below illustrate the dramatic change in the company’s revenue and earnings trends delivered in the December quarter. 
Against a backdrop of foreign exchange headwinds, Apple’s recognized revenue on a sequential basis rocketed higher by 77.1% in the period. On a year-over-year basis, revenue rose 29.53% The December quarter delivered the highest rate of year-over-year revenue growth since the March quarter of FY2012, nearly three years ago. On  a sequential basis, the rate of revenue growth was the fastest rate of growth in the study period of just over six fiscal years or twenty five fiscal quarters. 
On a year-over-year basis, Apple’s 47.83% rise in earnings per share was the fastest rate of growth since the March quarter of FY2012 and on a sequential basis, the fastest rate of growth in the twenty five fiscal quarters under study. Aided by the ongoing $90 billion share repurchase program, Apple’s record net income of $18.024 billion translated into earnings per share of $3.06 in the December quarter. In the period net income rose 37.88%.

Monday, October 28, 2013

Apple’s Think Different Approach To Quarterly Math

On October 28, 2013, Apple announced quarterly results for the period ended September 28, 2013. For the quarter, Apple announced revenue of $37.472 billion and earnings per share of $8.26 on 909.131 million fully diluted shares in the count. Net income was precisely 20% of reported revenue in the period. 

What surprised the market was Apple’s very conservative guidance for the December quarter. Although the quarter will most likely represent the highest revenue, net income and earning per share quarter in the company’s history, management has guided to revenue of between $55 billion and $58 billion and gross between 36.5% and 37.5%. The top end of revenue guidance suggests a 6.4% year-over-year revenue gain and the gross margin guidance range suggests a deterioration in the company’s year-over-year gross margin performance. In the year-ago quarter, Apple reported gross margin of 38.63%.

In the challenging fiscal year ended in late September, Apple reported revenue growth of 9.2% to nearly $171 billion. iPhone unit sales in the fiscal year rose 20.16% to 150.257 million units and iPad unit sales rose 21.82% to 71.033 million units. At this time, there’s little reason to expect the unit sales growth performance from the company’s two most popular product lines to fall below the FY2013 rates of growth. But with all things Apple, there’s much more to the story.

iPhone and iPad Unit Sales
The graph below illustrates the combined unit sales of the iPhone and iPad lines over the most recent sixteen fiscal quarters, including iPhone unit sales in the quarters immediately preceding the original iPad’s release in the spring of 2010.


In each quarter of the sixteen quarters there has been year-over-year unit sales growth of no less than the recent September quarter’s 6.47% rate of growth. In the December quarter one year ago, combined iPhone and iPad unit sales rose 34.63% to 70.649 million units. 

The graph below illustrates combined iPhone and iPad unit sales by fiscal year. 

In the fiscal year ended in September, combined iPhone and iPad unit sales reached 221.29 million units on a 20.90% rate of unit sales growth. Still, Apple has guided to no more than 6.4% revenue growth in the current December quarter. 

Saturday, August 17, 2013

Apple's Challenging Metric Conversion

On Friday, August 16th, Apple's share price closed above $500 for the first time since January. The recent announcement by Carl Icahn of his investment in Apple, the completion of the first big phase of the planned $60 billion share repurchase program and better than expected iPhone sales in the June quarter have combined to catapult the share price off the 52-week low of $385.10 set back in April.

From the all-time high of $705.07 reached last September to the 52-week low set in April to the closing price of $502.33 on Friday, Apple's share price has gyrated wildly over the past twelve months.

Within weeks Apple will announce its fall product refreshes for the iPhone and iPad lines. Rumors and speculation about the company's forthcoming new products are again receiving broad press coverage. The product news will come at the tail end of Apple's most challenging fiscal year in recent history.

In late October, Apple is likely to report negative net income growth for the fiscal year ending in September and a fourth consecutive quarter of tepid revenue growth. The deterioration in Apple's year-over-year profitability is due in part to the outsized revenue and earnings growth rates achieved in the prior fiscal year. In FY2012, Apple's revenue rose 44.58% and earnings per share rose 59.60%. In the first three quarters of the current fiscal year, Apple's revenue growth rate was 10.7%. Net income, a better metric than earnings per share as Apple repurchases tens of millions of shares, is down 11.89% year-over-year.

Apple's Challenging Metric Conversion
In today's article I am publishing a series of graphs that detail the recent deterioration in a select set of financial performance metrics and mention the challenges Apple faces as management strives to return the company to strong rates of revenue and earnings growth.

Apple's Revenue Growth Rates
The graph below illustrates Apple's revenue growth and revenue growth rates over the most recent fifteen fiscal quarters. 
Although the company has eked out revenue growth of 10.7% in the first nine months of the current fiscal year, due in part to a roughly $1 billion sequential drop in channel supply value in the recent June quarter, the reported revenue growth rate in the period was 0.86%. Apple is now experiencing its slowest rate of revenue growth in years and the revenue growth rate so far this fiscal year is below the 14.4% revenue growth rate realized in recession-plagued FY2009.

Apple's Earnings Per Share Performance
The graph below illustrates Apple's earnings per share and eps growth rates by quarter since FQ1 2010. 

In the first three quarters of the current fiscal year, Apple has reported negative earnings per share growth. Over this nine-month period eps has fallen 11.61% year-over-year to $31.36. The recent negative eps growth is despite fewer shares outstanding in the recent March and June quarters.  In the June quarter, Apple's $7.47 eps performance fell below the $7.79 per share earned two years prior in FQ3 2011.

Saturday, July 27, 2013

Apple: Where From Here?


On Tuesday, July 23rd, Apple announced results for the company's third fiscal quarter of  2013. The company surprised Wall Street with year-over-year iPhone unit sales growth of 20% to 31.241 million units despite a 600,000 unit reduction in global channel supply to 11.0 million units. iPhone unit sell-through in the quarter was about 31.84 million units. 

iPad unit sales were a disappointment in the period, falling year-over-year by 14.23% to 14.617 million units. Management emphasized during the quarterly conference call that reported iPad unit sales were negatively impacted by a 1.9 million unit swing in channel supply year-over-year. Meanwhile, Mac unit sales fell 6.62% to 3.754 million units. In the June quarter Apple did not refresh its MacBook Pro line, but refreshed the MacBook Air line only. One year ago both the MacBook Air and the MacBook Pro received a June quarter update. 

For the quarter, revenue rose a scant 0.86% to $35.323 billion and net income fell from $8.824 billion in the June quarter last year to $6.90 billion in the quarter ended June 29th. 

Despite the stronger than expected iPhone unit sales numbers and the fact Verizon and AT&T activated more iPhones in the June quarter than all other makes of smartphones combined, the quarter's results highlight Apple's many challenges moving forward. While revenue in the Americas region rose 12% in the June quarter, Greater China delivered a 14% decline in revenue and Apple's Retail revenue segment had a $10 million year-over-year revenue setback despite more stores open for business. 

Apple: Where From Here?
In today's article I will detail changes that are occurring in Apple's revenue flow and why the company's road to earnings recovery may take some long and winding turns.   

Apple As An Eco-System 
Apple has moved beyond the scope of being primarily a device maker. In the June quarter revenue from the company's iTunes/Software/Services revenue segment rose nearly 25% to $3.99 billion and represented 11.3% of reported revenue. The graph below illustrates the growth in what was the company's fastest growing revenue segment in the period. The fairly consistent revenue growth in the iTunes/Software/Services segment is contrasted in the graph with the seasonal revenue performance of Apple's Accessories segment that experienced a 4% revenue decline in the recent quarterly period.

Of the $3.99 billion in segment revenue, $2.4 billion was sourced from iTunes alone. Since the opening of the Apple app store, $11 billion has been paid through to developers. According to management, half of the $11 billion was earned by developers within the past 12 months. iTunes billings, separate from recognized iTunes revenue, reached $4.3 billion in the June quarter.

Saturday, March 23, 2013

Apple's March Quarter Madness

Saturday, March 30th will mark the end of Apple's second quarter of FY2013. With near certainty, the March quarter will represent the first quarter of negative net income growth in the company's recent history. It may also represent the low point in a multi-quarter cycle of reduced rates of revenue and earnings growth. 

In this article I will analyze Apple's growth performance since the first quarter of FY2011, why earnings growth will most likely turn negative in the current quarter and the ways in which Apple will begin to return to stronger rates of revenue and earnings growth as early as the June quarter of the current fiscal year. Apple's "March Quarter Madness" is the beginning of the end of a cycle of lowered rates of growth.

Apple's Revenue and EPS Growth Rates
The graph below illustrates Apple's rates of revenue and earning per share growth since  FQ1 2010.
Since FQ3 2012, Apple's rate of year-over-year earnings per share growth has fallen below the rate of revenue growth. This trend will continue through the March quarter due to the extraordinary high gross margin achieved in the first half of last fiscal year. 

Apple's Gross Margin Performance
The Graph below illustrates Apple's gross margin performance since FQ1 2010. 
It's not a coincidence Apple's gross margin reached extraordinary high levels in the first six months following the release of the iPhone 4S. The iPhone 4S is the second handset in the iPhone 4 series and delivered record gross margin due in part to Apple's ability to apply the fixed costs of iPhone 4 series production over a much larger number of units sold. 
In the recent December quarter (FQ1 2013), the first full quarter of iPhone 5 sales, Apple's gross margin outcome was nearly identical to the outcome in FQ1 2011, the first holiday quarter of sales for the iPhone 4 handset. Looking forward, Apple's gross margin performance will improve following the release of the second iPhone 5 series handset. Economies of scale on iPhone 5 series handset production will improve dramatically as the next iPhone 5 series handset finds its way to market. The trend is vividly displayed in the graph above. The first full quarter of release of the iPhone 4 handset (FQ4 2010) represents the low point for gross margin over a more than three-year period.

Thursday, January 24, 2013

The Mysterious Case of Apple's Missing Growth


Under the headline "Apple Reports Record Results," the company delivered what appears at first look a modest performance in its December quarter. For the 13-week period ended December 29, 2012, Apple reported revenue of $54.512 billion and earnings per share of $13.81. The outcome represents revenue growth of 17.65% over the prior-year period and a slight decline in earnings per share from $13.87. 

The December quarter, Apple's first quarter of FY2013, was 13 weeks in length versus 14 weeks in the prior-year period. Apple's fiscal quarters are usually 13 weeks in length and always end on a Saturday. Every 5 or 6 years, depending on the number of leap days in the multi-year period, Apple adds a 14th week to its first fiscal quarter to align fiscal quarters closer to calendar quarters. On a weekly basis, Apple's revenue was $4.2 billion in the recent December quarter versus $3.3 billion in the prior-year period. On an equal week basis, revenue in the quarter rose 26.7%

However, the market's response to the December quarter results drove the share price down more than 12% to just over $450 on extraordinarily high volume the day after the release of earnings. Apple's overall revenue growth rate and the rate of growth in iPhone and iPad unit sales did not impress the Street. 

iPhone and iPad Unit Sales
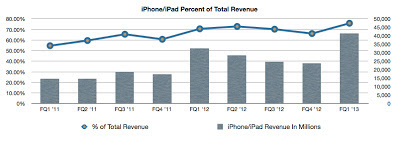
In the December quarter, iPhone unit sales rose about 29% to 47.789 million units and iPad unit sales rose about 48% to 22.86 million units. iPhone revenue growth tracked close to the rate of growth in unit sales, but iPad revenue rose only 22% year-over-year due to the influence of the lower-cost iPad mini. 

The graph below illustrates the rising percentage of Apple's revenue provided by the iPhone and iPad lines. 

Mac and iPad Unit Sales
In the December quarter, Mac unit sales fell about 22% due in large part to constrained supplies of the new iMacs. Apple ended the December quarter with Mac channel supply below the desired target range. As expected, iPod unit sales continued to decline. Apple sold about 12.679 million iPods, off 18% on a year-over-year basis. 

Apple's high concentration of revenue in its newest product lines, the 14-week prior-year period and lowered gross margin due to multiple product transitions in the quarter, created an outcome that underwhelmed investors. Gross margin dropped from last year's unsustainable 44.68% to about 38.63% in the December quarter. But there's more to the story.

Tuesday, July 24, 2012

June Quarter Results: Apple's Melancholy Moment


On Tuesday, Apple reported underwhelming results for the three-month period ended June 30, 2012. For the quarter, Apple reported revenue of $35.023 billion and earnings of $9.32 per share, representing 22.58% revenue growth and eps growth of 19.57%. The fiscal quarter's outcome, against expectations of much stronger growth, represents Apple's melancholy moment and a slow-growth period in a six-quarter era of exceptional growth that began with the first quarter of the current fiscal year. 
Guidance and The Economy
For the current quarter, management offered conservative guidance of $34 billion in revenue and $7.65 in earnings per share. In the June quarter, all of Apple's major product lines, including the iPhone and the iPad, had unit sales results that were impacted by a challenging global economy, particularly in Europe. The iPhone's uninspiring 28% unit sales growth was also influenced by consumer expectations of a pending refresh of the product line. 
Apple's quarterly results represent a static snapshot of a fast-moving company. As much as the June quarter results were a disappointment, the outcome reveals both challenges and opportunities in the fiscal quarters ahead. 
Gross Margin
In the first six months of the current fiscal year, revenue growth zoomed forward at a 66% pace and earnings per share rose 104%. Apple's average gross margin during the six-month period was 45.9%. In the June quarter, gross margin dropped to 42.8% due to the impact of currency fluctuations, the lower price on the iPad 2 and a change in model mix on iPhone sales. Apple's gross margin moving forward may remain closer to the June quarter's outcome rather than return to the very high gross margin reported in the first two quarters of this fiscal year. Moderation in gross margin will move the rate of earnings per share growth closer to the rate of revenue growth in future quarters. 
In the first six months of the current fiscal year, the iPhone represented 55% of Apple's revenue total and the popular iPhone 4S delivered very attractive gross margin. In the June quarter the iPhone represented just over 46% of revenue.  The iPhone's smaller percentage contribution to the quarter's revenue total and the lower price on the iPad 2 lead to a sequential drop in gross margin from 47.37% to 42.8%. Although the successor to the iPhone 4S will generate industry leading gross margin, the change in the company's overall revenue mix and anticipated higher costs for the new flagship handset will influence gross margin throughout Apple's next fiscal year. 
Operating Expenses
Operating expenses, inclusive of stock-based compensation, remained under 10% of revenue in the June quarter. Operating expense discipline continues to positively impact the percentage of revenue that flows to the company's net income line. In the June quarter, about one-third of revenue flowed to the operating income line and about one-quarter of every revenue dollar landed on the net income line.
The iPhone Product Cycle
Throughout the conference call with analysts, management repeatedly mentioned the impact of consumer expectations of an imminent iPhone product line refresh on unit sales in the quarter. Consumers will, by the millions, postpone or delay iPhone purchases and iPhone handset upgrades in favor of waiting on the release of new models.
There are a number of factors that determine or influence the release dates for new iPhone handsets. These factors include production capacity, component supplies, planned releases of iOS updates and contracts with iPhone carriers. None of these factors are changed by consumer expectations for the release of a new iPhone.
At this time, all points lead to a fiscal first quarter (fourth calendar quarter) release of the successor to the iPhone 4S. The iPhone 4S will remain the company's flagship iPhone handset for about 12 full months. Very high rates of revenue growth will be realized in the first two quarters of next fiscal year due to the release of a new flagship iPhone and the expected lower prices on the iPhone 4 and iPhone 4S models. Between now and the release of a new iPhone handset, overall revenue growth will be held in moderation even with a strong September quarter for the Mac and iPad product lines. 

Saturday, June 23, 2012

Apple's Net Income Thrill Ride

Last week in an article titled, Apple's Revenue Growth: A Dual-Track Bullet Train, I analyzed Apple's rates of revenue growth and the company's relentless geographic expansion that supports the fast rates of growth. In today's article, I am providing an overview of Apple's net income growth and the influences on the company's rising profitability.

Apple's Net Income Thrill Ride
Apple is not only a fast-growing mega-cap, the company has defied conventional wisdom by increasing the percentage of revenue that flows to the net income line while revenue and in many cases market share, continue to rise across the company's major product lines. 
The graph below illustrates the rising percentage of each revenue dollar that flows to the company's net income line:

Over the most recent ten fiscal quarters, the percent of revenue that has reached the net income line has leaped from 21.54% of revenue in FQ1 2010 to 29.66% of revenue in FQ2 2012. Rising gross margin due to superb supply chain management, economies of scale, operating expense discipline and moderating tax rates have all factored into Apple's impressive percentages of revenue that have flowed to the net income line. 

Apple's Gross Margins
The graph below illustrates Apple's gross margins over the most recent ten fiscal quarters.


There's no disputing the fact the iPhone 4S has delivered very high gross margins. However, the high gross margins delivered by the iPhone 4S over the two most recent quarters were due primarily to economies of scale and not increases in average revenue per unit sold. In FQ1 2010, average revenue per iPhone unit was $638 versus $647 per unit in FQ2 2012. In FQ4 2011, average revenue per iPhone handset sold was $643.  Revenue per handset includes the revenue generated by Apple through the sales of Apple-branded and third party iPhone accessories. My Apple Unit Sales page chronicles the unit sales growth of each of Apple's major device lines over the most recent fourteen fiscal quarters. 
The iPhone's high gross margins exemplify Apple's extraordinary supply chain management and the benefits of economies of scale. This is not an issue of rising revenue per handset. It's primarily an issue of unit sales growth. 

Saturday, January 7, 2012

Apple's "Monster Quarter" Will Deliver Monster-Sized Results


Apple stands at the threshold of becoming the nation's largest technology company. Apple will soon surpass Hewlett-Packard in quarterly revenue while delivering more than $.25 of each revenue dollar to the net income line. By the end of this month and in response to the company's December quarter results, Apple will again surpass Exxon-Mobil in market cap to become the nation's most highly valued enterprise.
To put Apple's recent rates of growth in perspective, in FY2011 that ended in late September, the company's $108.249 billion in revenue represented a 677% rise in revenue in the six years since FY2005 and the $27.68 in earnings per share represented 1,686% growth over this same six-year period. Apple is the undisputed enterprise success story of the new millennium.
It's product innovation that drives Apple's accelerated rates of growth and it's innovation that will deliver monster-sized results in what I have dubbed "Apple's Monster Quarter."

Today I am publishing my revenue and earnings estimates for Apple's first quarter of FY2012 ended December 31st. For the quarter I estimate revenue of about $44 billion and earnings per share of $12.20. In this one quarter Apple's revenue and eps results will most likely exceed the company's total revenue and earnings per share for all four quarters of FY2009 that ended just over two years ago. These estimates represent an expectation of 64.54% year-over-year revenue growth in the quarter and 89.75% growth in earnings per share.
The Sources of Apple's Frenetic Rates of Growth
Apple's accelerated rates of growth are fueled by the popularity of the company's iOS-based products including the iPhone and iPad and the company's relentless geographic expansion. Currently, the only practical limits on Apple's rates of growth are device production capacity and the pace at which the company can create sales and support infrastructure in underserved global markets. At this time Apple is addressing only a fraction of the global market for the company's digital lifestyle products. 

Although domestic revenue as a percent of total revenue will rise in the December quarter due to the initial release of the iPhone 4S in the United States and the addition of Sprint as an authorized iPhone carrier, by next fiscal year revenue sourced from outside the United States may represent two-thirds of the company's revenue total.

The graph below illustrates the influence of the iPhone and iPad on my anticipated December quarter revenue outcome. Collectively the two products represent about 71.5% of estimated revenue in the quarter and both products have been brought to market within the past five years. 

Saturday, November 19, 2011

Understanding Apple's Rates Of Growth

Apple's 21st Century Renaissance
Since the start of the new millennium, Apple has become among the nation's most highly valued enterprises measured by market cap, the world's largest distributor of music, a major global retailer and the biggest mobile device maker when ranked by revenue. Apple's rates of growth over the past six years have been so strong, in FY 2011 revenue surpassed $100 billion. By the end of the company's FY 2013 in September of that year, revenue will surpass $200 billion. This article is intended to assist readers in understanding Apple's recent and near-term rates of revenue and earnings growth.

Apple's Frenetic Rates of Growth
In the six fiscal years since FY 2005, Apple's annual revenue rose 677% to FY 2011's $108.249 billion. During this six-year period earnings per share rose an astonishing 1,686% to FY 2011's $27.68. 
To put the current rates of growth in perspective, in each quarter of FY 2011, revenue exceeded the company's total revenue of $24.578 billion FY 2007.  Earnings per share in FY 2011 reached the combined eps totals for fiscal years 2006 through 2009 with over $5 per share to spare.
Beyond doubt, Apple is an extraordinary success story of the early 21st Century. It was only ten years ago the first iPods came to market and it's been less than five years since the iPhone was initially announced. While understanding Apple's success seems simple when viewing six-year growth charts, over the past few years Apple's success story has become more complex.

Apple's Recent Quarterly Rates of Growth
Apple's frenetic rates of growth have become as challenging to understand as they are to accurately forecast. Graphs of the company's quarterly revenue and eps performance over the most recent eight fiscal quarters are posted below to illustrate the changes in Apple's quarterly revenue and earnings growth cycle:

Saturday, October 29, 2011

Apple's Unrelenting Mac Attack On The PC Market

In Apple's most recent fiscal year ended in September, the company's Macintosh line of personal computers generated revenue of $21.783 billion, representing 20.12% of Apple's $108.249 billion in reported revenue. The Mac's $4.304 billion gain in revenue during the fiscal year represented 10% of Apple's $43 billion in revenue growth. 
Although the $21.783 billion in revenue generated from Mac sales in FY 2011 represented only 20.12% of the company's revenue total, it exceeded Apple's total reported revenue of $19.315 billion in FY 2006, just five years before. In FY 2011, revenue generated from Mac sales exceeded the revenue generated from iPad sales by $1.425 billion. 

Apple's Unrelenting Mac Attack On The PC Market
The graphs and table data in this article illustrate and delineate Apple's unrelenting Mac attack on the PC market. For over five consecutive years the rate of growth in Mac unit sales has exceeded the rate of unit sales growth for the PC industry as a whole. In only one quarter of the most recent twelve fiscal quarters has Apple experienced a year-over-year unit sales decline. In FY 2011 Macintosh unit sales rose about 22.5% to 16.735 million units following a 31% rise in unit sales in FY 2010. 

In the current quarter ending in December, Macintosh unit sales may reach 5 million units for the first time in the company's history, breaking the unit sales record of 4.894 million units sold in the recent September quarter. 

Sunday, October 2, 2011

Why Apple's FQ4 Earnings Will Approach $10 Per Share

There's no other company on the planet that excites the imagination of its product users as much as Apple. In developing revenue and earnings estimates for the company, I am guided by one overarching principle:
Apple doesn't sell products. Apple crafts customer relationships and those relationships sell Apple products. 
Understanding Apple's Pathways To Success
Understanding Apple's pathways to success requires more than an effort at counting the number of individual products that might be sold. It necessitates understanding the company's eco-systems and what motivates enterprises and consumers to invest in the purchase of Apple-branded products. 

My analysis relies heavily on the company's historical growth trends and an evaluation of the phenomena that occur when appealing and abundant content is made readily available for smartly designed devices. These products are offered to customers who have established a relationship with Apple through iTunes, through visits to the company's retail stores or have a long-standing relationship with the company through the use of Apple's popular Macintosh line of personal computers. 
Below are my estimates for the company's September quarter and an overview of the elements that underly the assumption Apple's FQ4 earnings will approach $10 per share:


Revenue Segment

Units FQ4 ’11
Units FQ4 ’10
Unit Growth
FQ4 Revenue


Macintosh

4,500,000
3,885,000
15.83%
5,737,500,000

iPhone

26,500,000
14,102,000
87.92%
17,225,000,000

iPod

7,250,000
9,051,000
-19.90%
1,268,750,000

iPad

14,500,000
4,188,000
246.23%
9,425,000,000

Peripherals


620,000,000

Software, Services


800,000,000

Other Music


1,625,000,000

Revenue Total


36,701,250,000


Cost of Sales

58.20%


-21,360,127,500

Gross Margin

41.80%


15,341,122,500

Operating Expenses

8.79%


-3,225,000,000

Operating Income


12,116,122,500

Other Income


200,000,000

Income Before Taxes


12,316,122,500

Provision For Taxes

23.50%


-2,894,000,000

Net Income


9,422,122,500


Earnings Per Share

(Based on 940.825 million shares)
10.01